
 Publication:10.07.2026
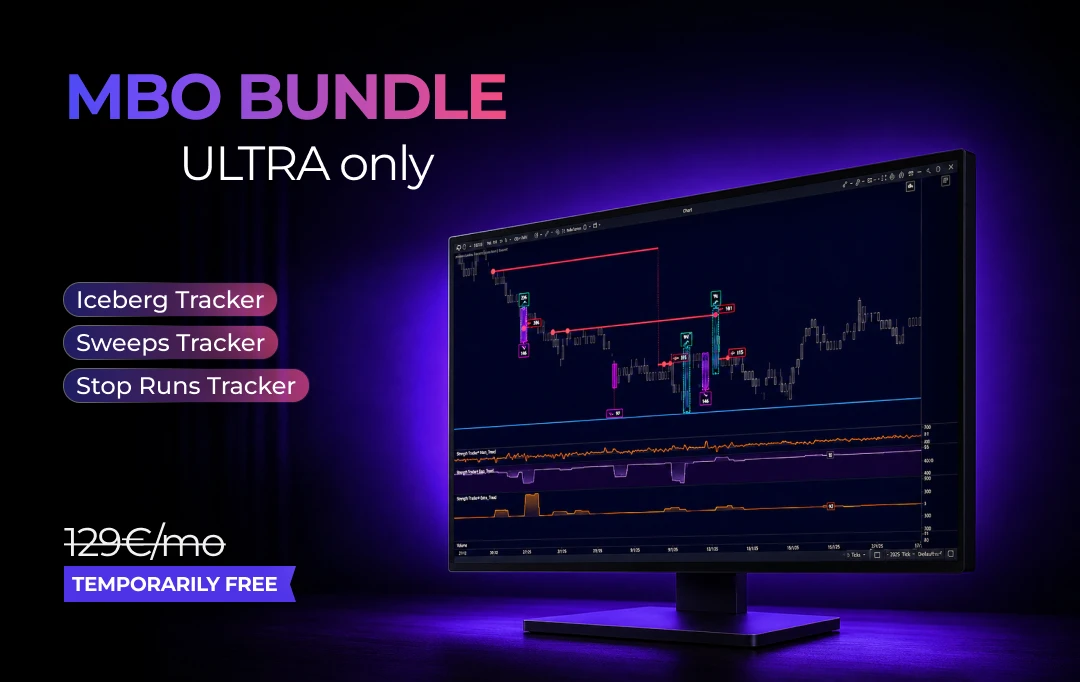
MBO Bundle
- Category: Algotrading
- Asset class: Futures, Stocks, Cryptocurrencies
Description
MBO Bundle: Deep Order Book Analysis at the Individual Order Level
A standard Level 2 order book displays data in Market-by-Price format — grouping orders by price — but the internal mechanics at each price level remain hidden.
Market-By-Order (MBO) format data changes your approach to market analysis. It opens the raw exchange stream, where each order has its own unique ID, allowing you to analyze queue sequence and order execution mechanics down to the finest details. Instead of guesses, you get visualization of hidden limit volumes, stop-order cascades, and aggressive price breakouts.
⚠️ MBO data is available only for futures when connected to Rithmic. dxFeed support is in development.
What's Included in the MBO Bundle
🧊 Iceberg Tracker
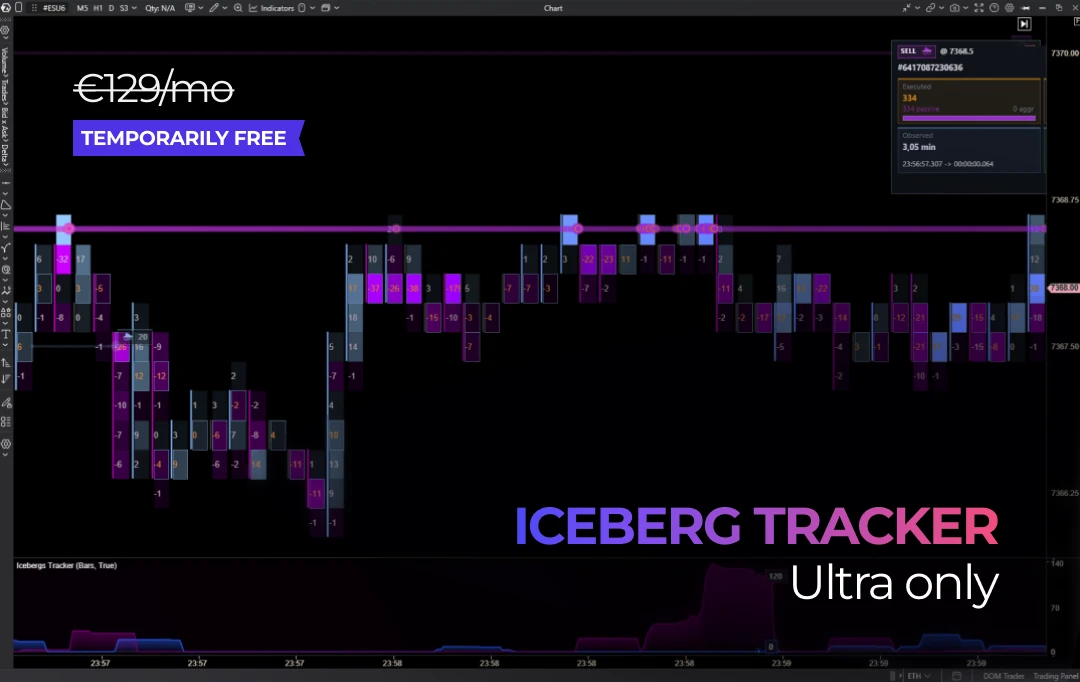
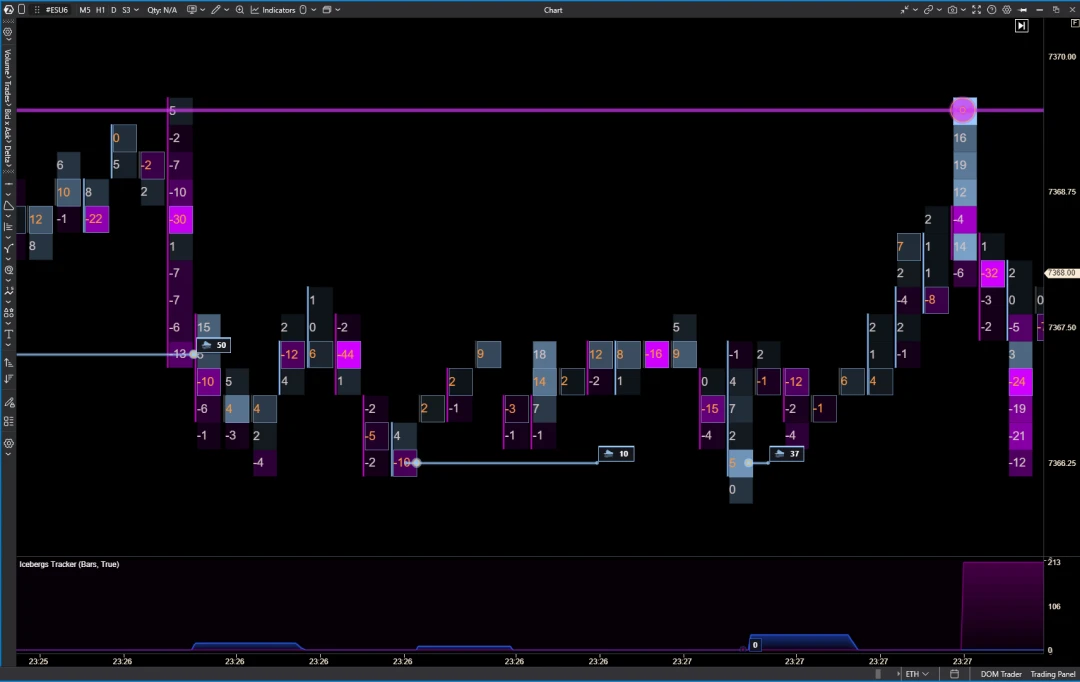
Icebergs are large limit orders, most of which are hidden from other market participants. Once the visible portion executes, the exchange automatically loads the next batch from the hidden pool (refill). Visually, the volume at the price level doesn't change, but with each refill, the order loses time priority and falls to the back of the queue.
Iceberg Tracker analyzes unique order IDs, the initial volume in the queue, how much volume has been executed, and whether the visible portion and queue priority have changed.
What the Indicator Shows:
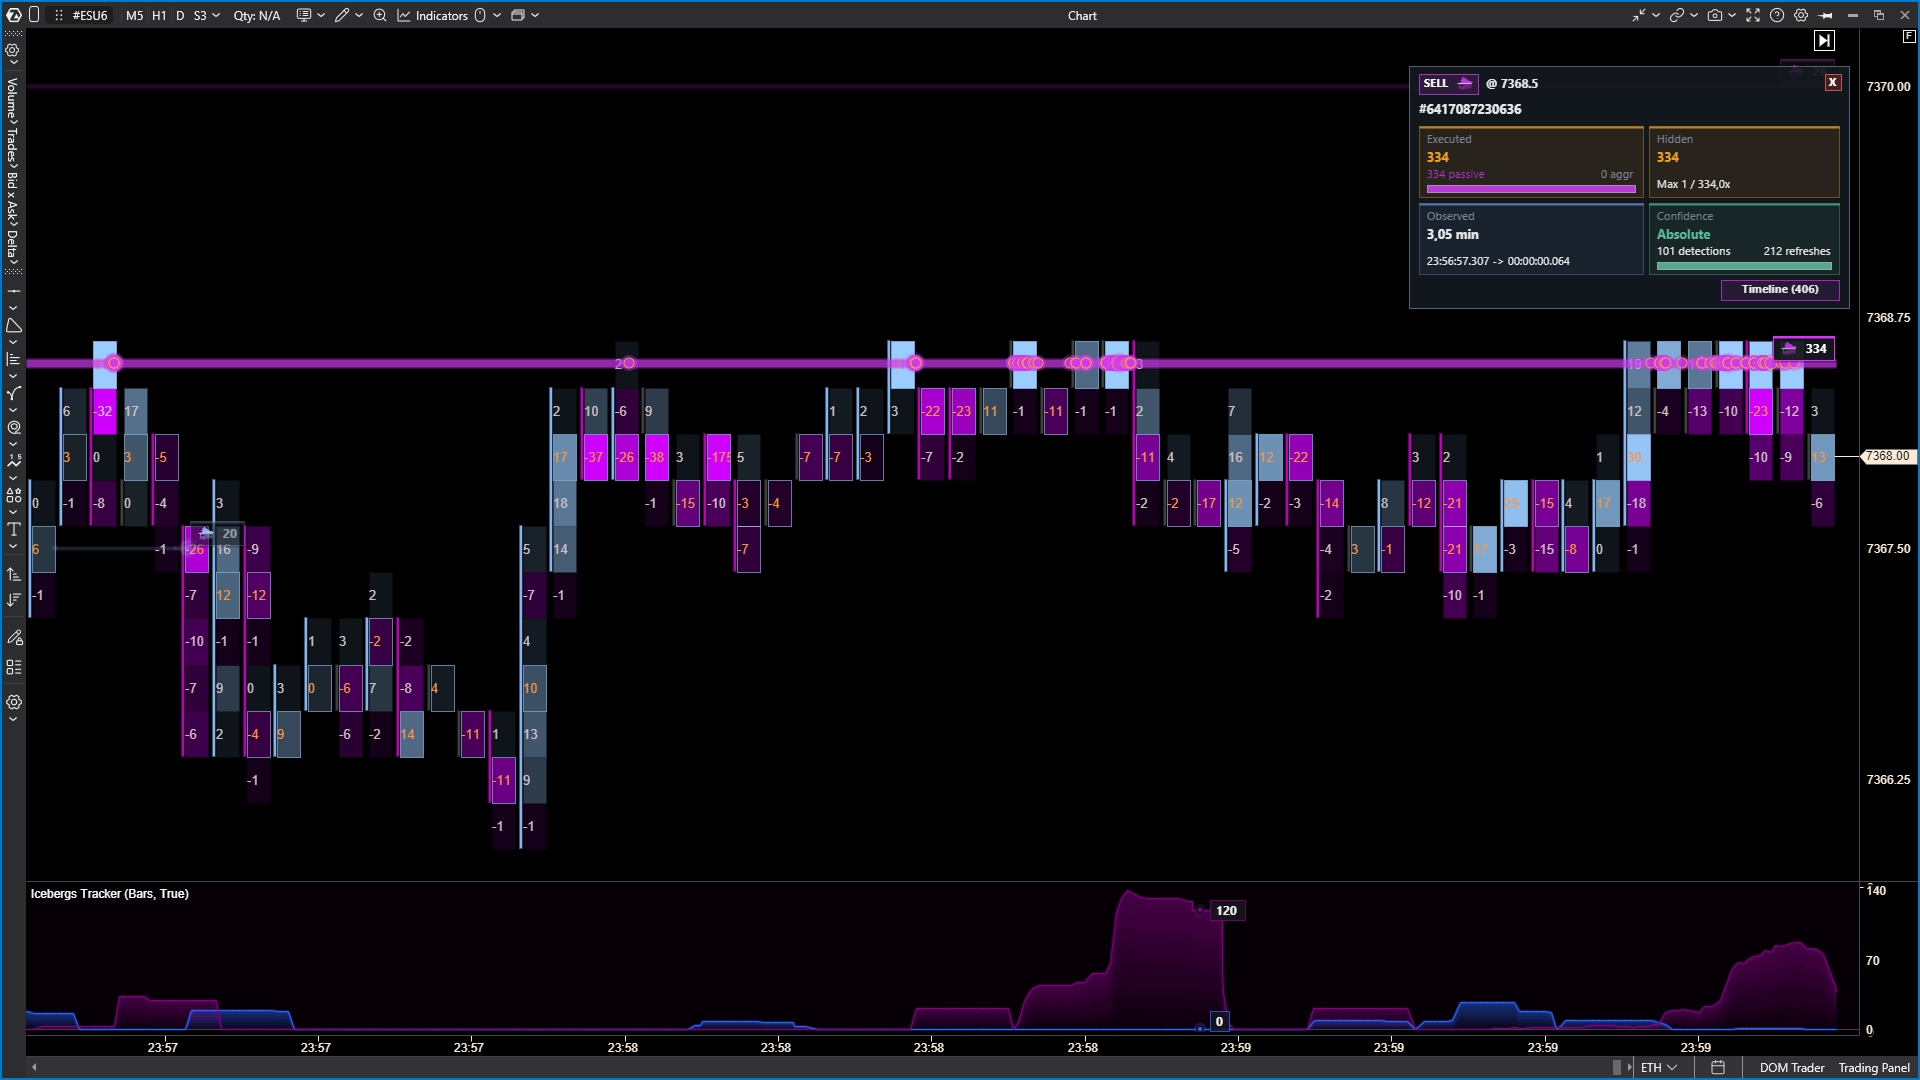
- The order's lifespan — the specific price at which the iceberg is placed and its direction (Bid or Ask).
- Hidden volume calculation — accumulated volume and trades that helped uncover the hidden limit (hidden volume).
- Trade detail — in Show Individual Trades mode, you can break down a large iceberg into individual tick prints directly on the chart.
- Interactive analysis — hover tooltips with detailed statistics (detail panel) and step-by-step chronology (timeline) of all events for the selected order.
- Activity histogram — the lower panel showing activity distribution across Bid/Ask and current delta.
🛑 Stop Runs Tracker
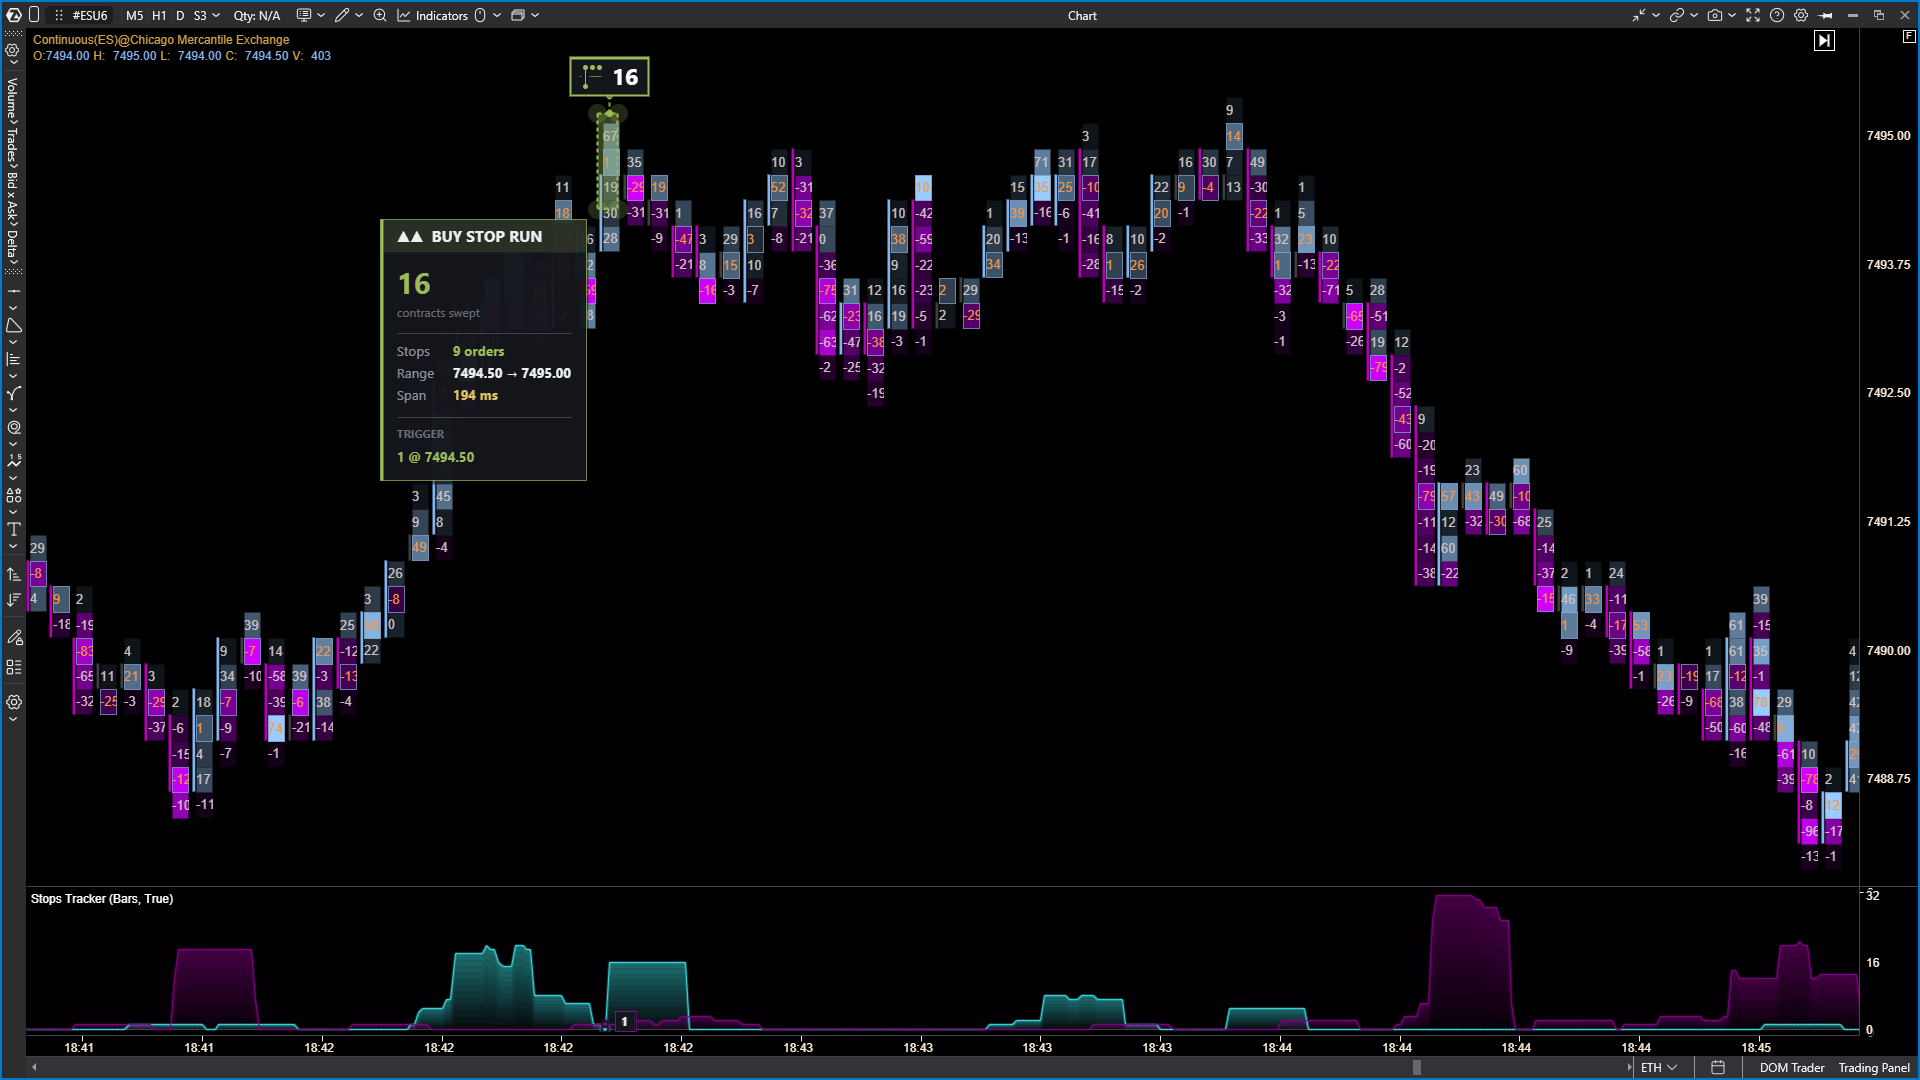
Stop orders (SL) are protective or breakout orders stored on the exchange server but invisible in the order book until execution. When price touches the trigger level, they instantly transform into regular market orders. When large stop clusters accumulate on adjacent price levels, a cascading avalanche reaction occurs — it rapidly depletes liquidity, triggering a sharp price impulse or market reversal.
Stop Runs Tracker analyzes unique order IDs in the MBO stream, identifies hidden stop orders at the moment they transform into market orders, and consolidates them into a single array.
What the Indicator Shows:
- Cascade zones — specific price levels where the avalanche of protective orders triggered, and their direction (Buy Stops or Sell Stops).
- Volume of triggered stops — the exact number of contracts forcefully executed within the cascade, allowing you to assess the scale of the imbalance.
- Trigger speed and density — markers of execution intensity that help you visually distinguish regular market orders from panicked position closures.
- Interactive analysis — hover tooltips with detailed statistics on volume, time, and the number of triggered orders in each cascade.
🌪 Sweeps Tracker
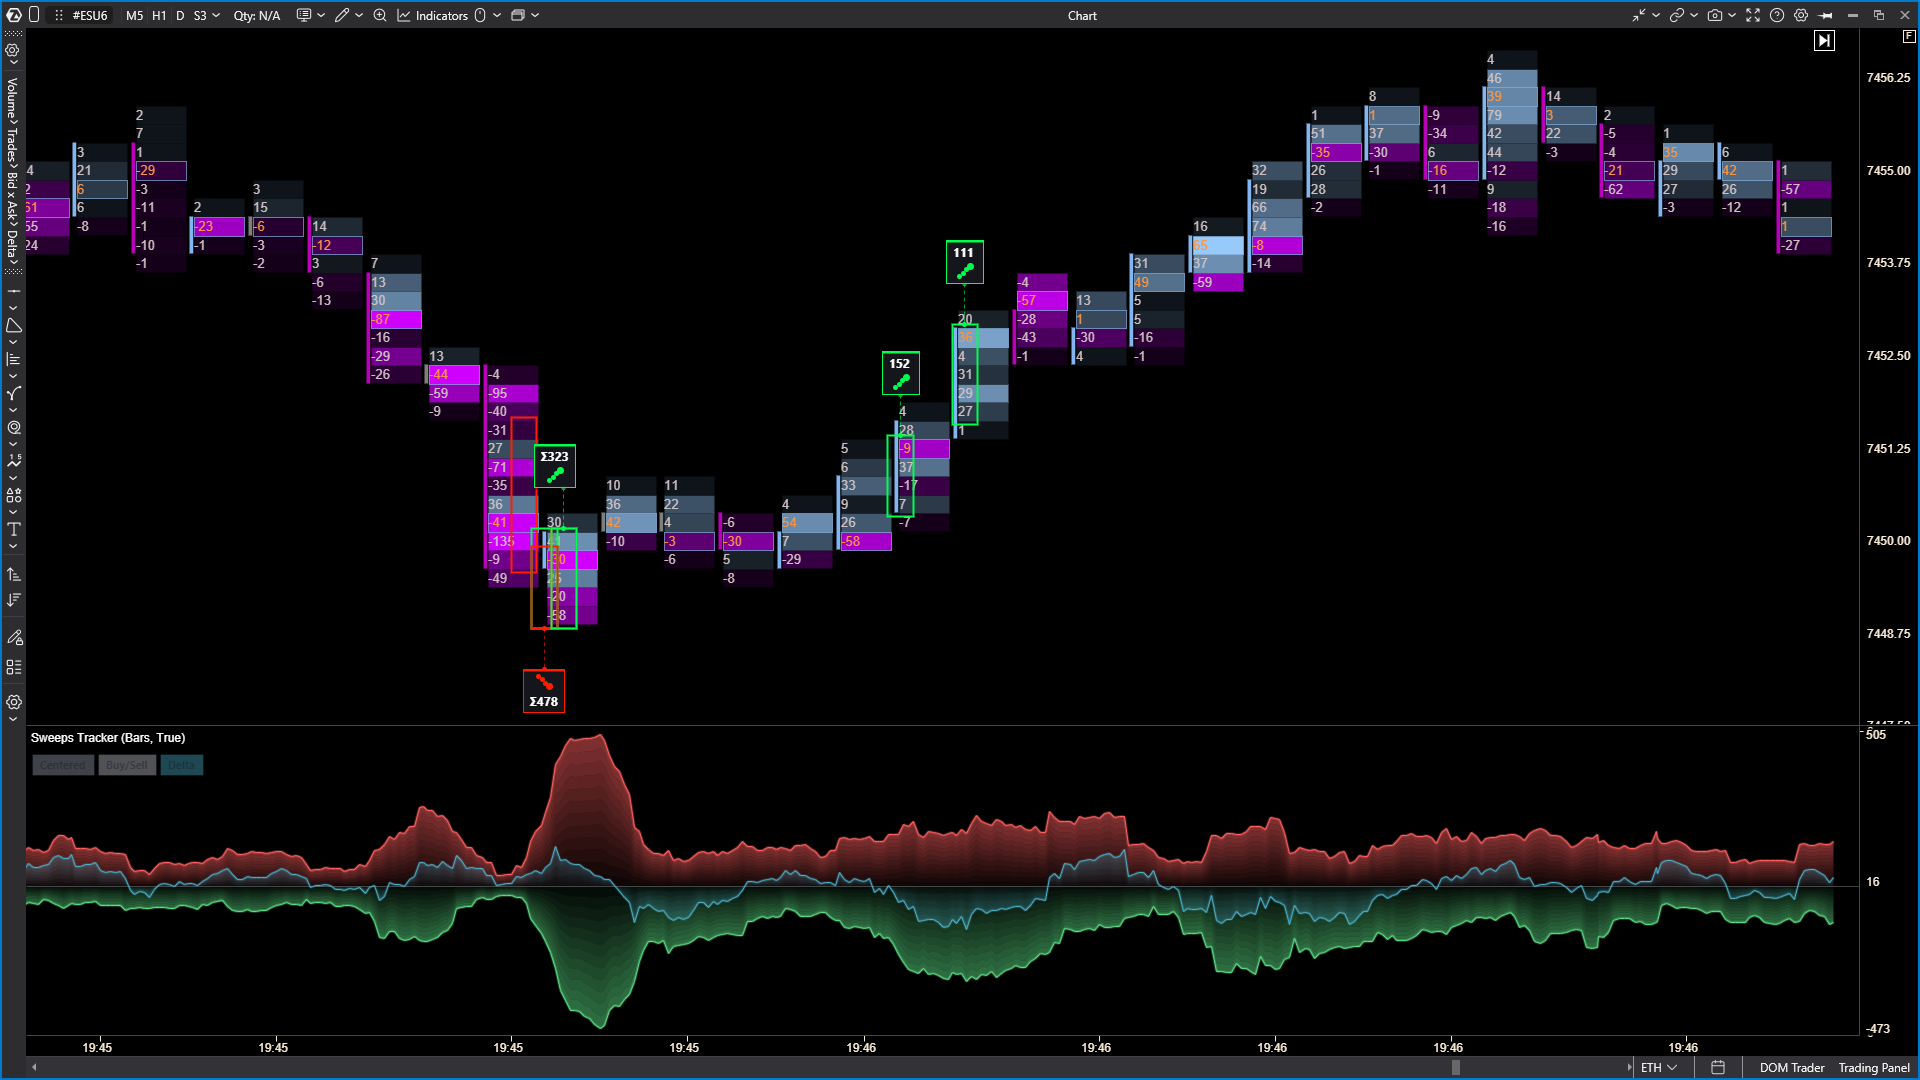
A Sweep is an aggressive market order of significant volume that executes instantly across multiple price levels in succession, literally "sweeping" liquidity from the order book. In a regular trade tape, such a breakout scatters into dozens of small, fragmented prints and gets lost in market noise. This makes it difficult to spot the real scale of point-in-time market aggression and assess impulse strength in time.
Sweeps Tracker analyzes unique aggressor IDs, finds the fragmented trades executed by the exchange, and automatically reassembles them back into the original single order.
What the Indicator Shows:
- Breakout range — visual highlighting of the price corridor that was swept by a single market impulse.
- True aggressor volume — the cumulative actual size of the large order before the exchange engine fragmented it against the order book limits.
- Direction of impact — clear marking of the aggression side (Buy Sweep or Sell Sweep) that triggered the impulse.
- Interactive analysis — hover tooltips with detailed statistics on the number of price levels touched, time, and total volume.
Access Terms
MBO Bundle is temporarily free for all Ultra plan users, including owners of perpetual licenses (Lifetime) and free trial users. This is a great opportunity to fully test the new tools in real market conditions and evaluate for yourself how useful they are for your analysis.
☝🏻 Later this year, the indicator bundle will become paid for all user categories — you'll be able to purchase it as a separate product directly from our marketplace.
How to Activate?
- To access the MBO Bundle indicators, you must have an active Ultra plan or its free trial period.
- Make sure you have access to Rithmic market data.
- Open a futures chart in ATAS.
- In the Indicator Manager, search for Icebergs Tracker, Stop Runs Tracker, or Sweeps Tracker. Click "Add to chart".
- If needed, adjust the visual settings and volume filters to match your trading strategy.
🔥 Coming soon: MBO Bundle indicators will also be available in Heatmap (Beta) — stay tuned for updates.
A software development company specializing in volume analysis of stocks, futures, and cryptocurrencies
This marathon provides a comprehensive system that covers market mechanics, key volume analysis strategies, and risk management.

The marathon will give you a clear system: from understanding market mechanics and the principles of constructing trading strategies to professional capital management.
Unlock advanced techniques of volume and order flow analysis in this 6-step intensive training. Whether you're ready to level up your system or eliminate blind spots in your market reading, this marathon is your next big step.
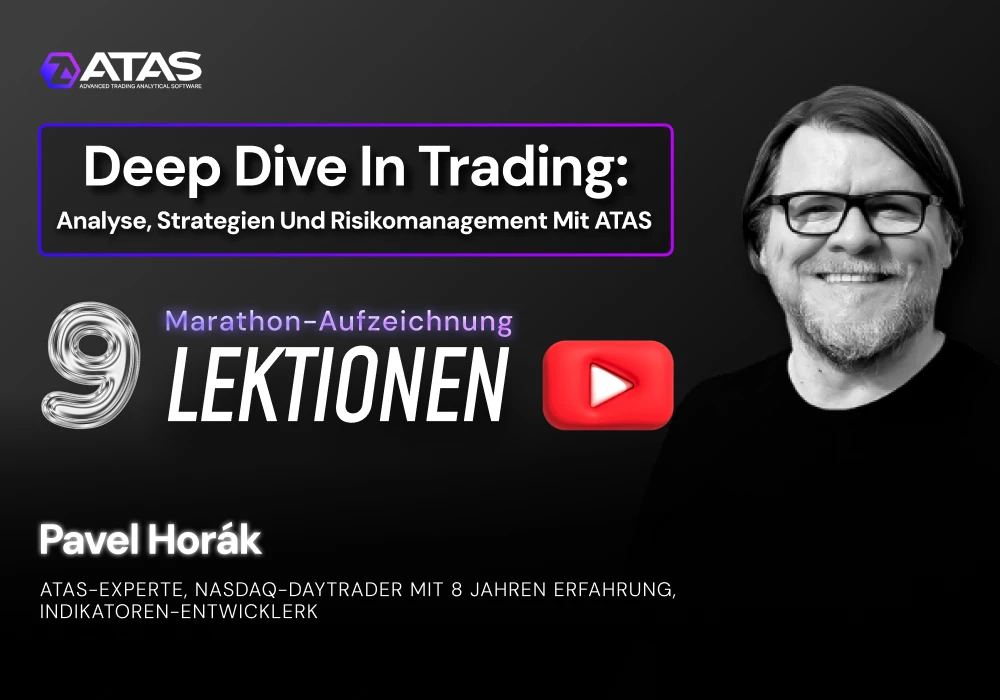
Dive into the world of volume analysis with our free 9‑part YouTube marathon “Deep Dive in Trading: Analysis, Strategies and Risk Management with ATAS”!
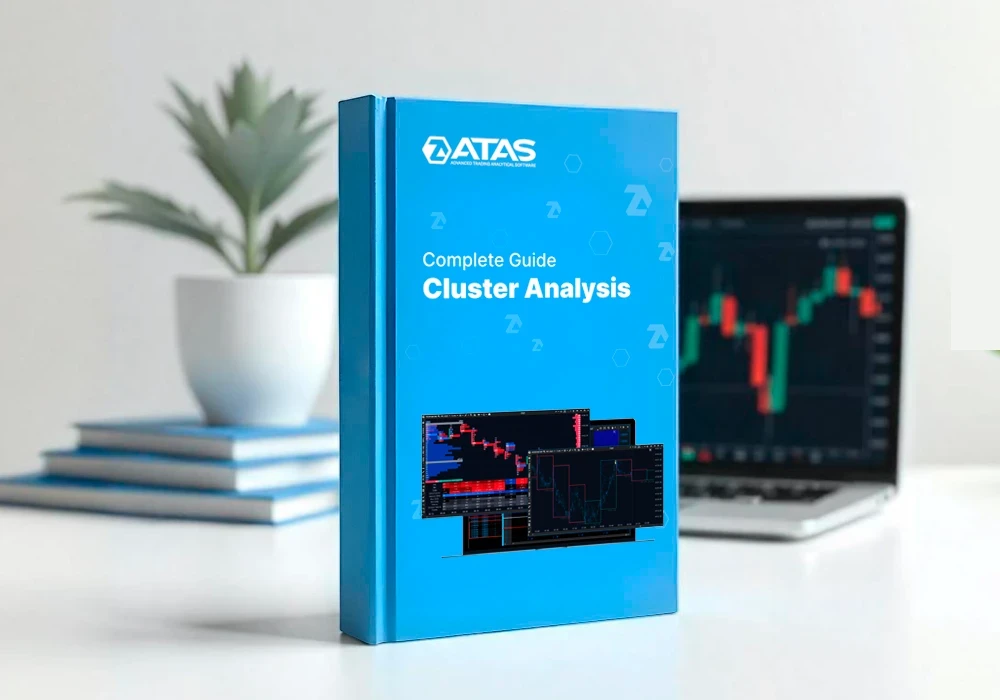
A practical guide to footprint chart analysis. Covers Bid/Ask, Delta, Volume Profile, imbalance detection, and auction analysis — helping traders read market dynamics and make informed decisions based on real data.
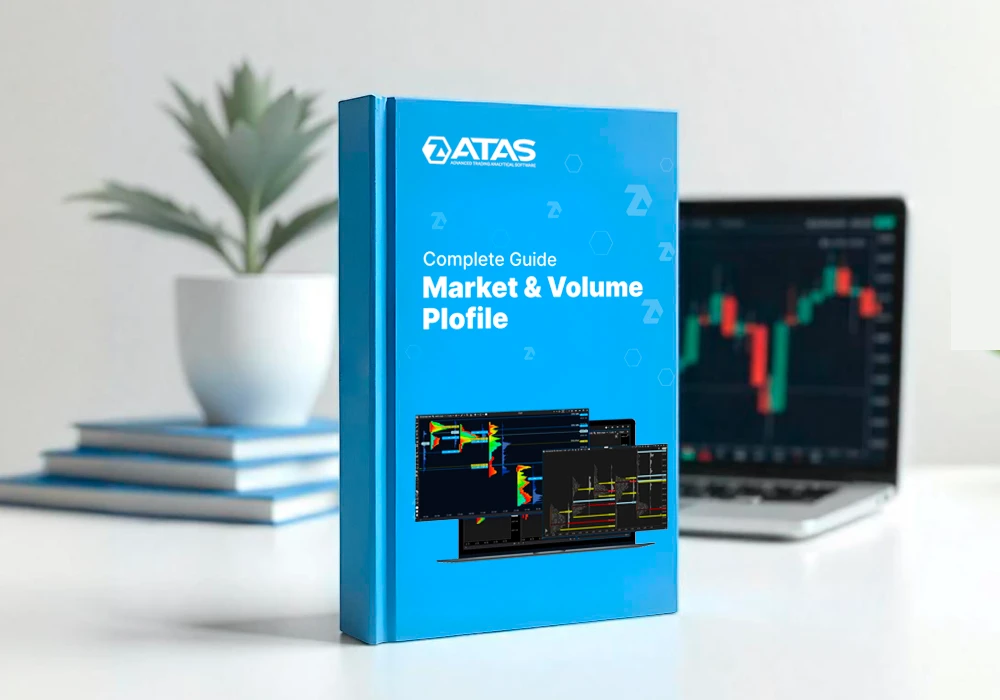
A practical guide to Market Profile and Volume Profile. Covers Auction Market Theory, TPO charts, Value Area, Point of Control, and volume analysis techniques for a deeper understanding of market structure and price formation.
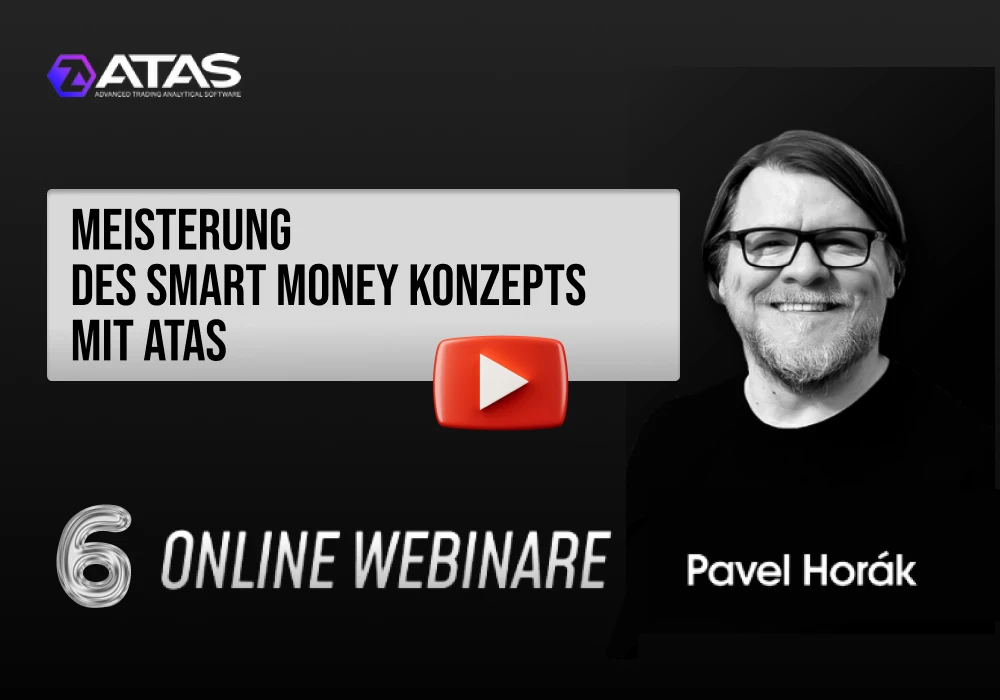
6-lesson ATAS marathon on Smart Money Concepts: liquidity, market structure, Fair Value Gaps, Order Blocks, accumulation/distribution cycles, and a complete SMC analytical framework — integrated with Footprint and Order Flow tools.
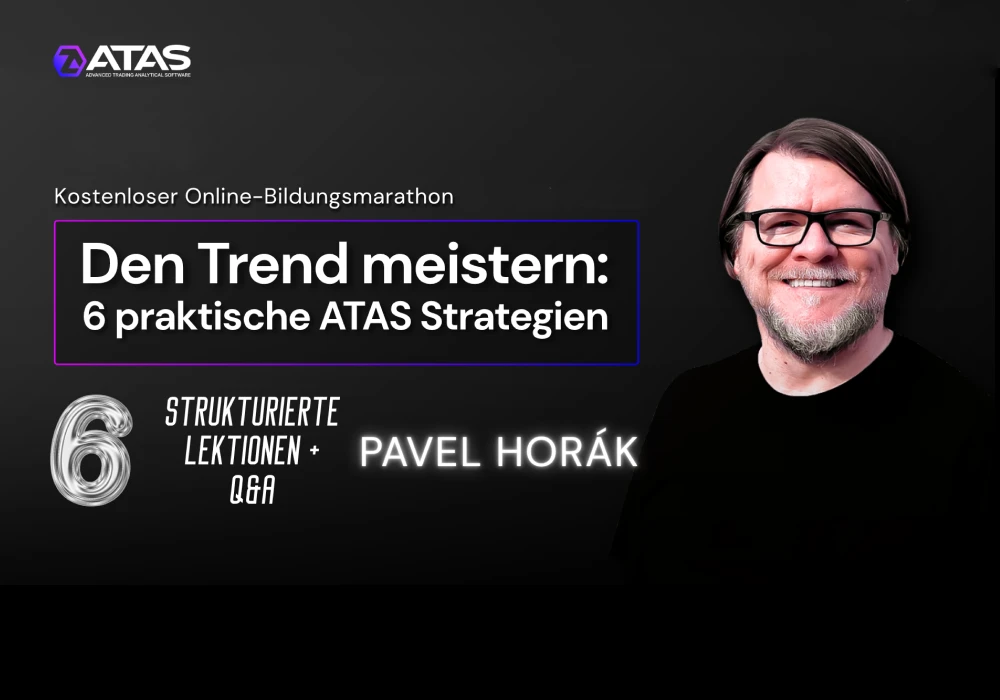
A hands-on intensive training with 6 lessons + Q&A. Learn how to identify and exploit trends using volume analysis, Order Flow tools and strategic thinking.
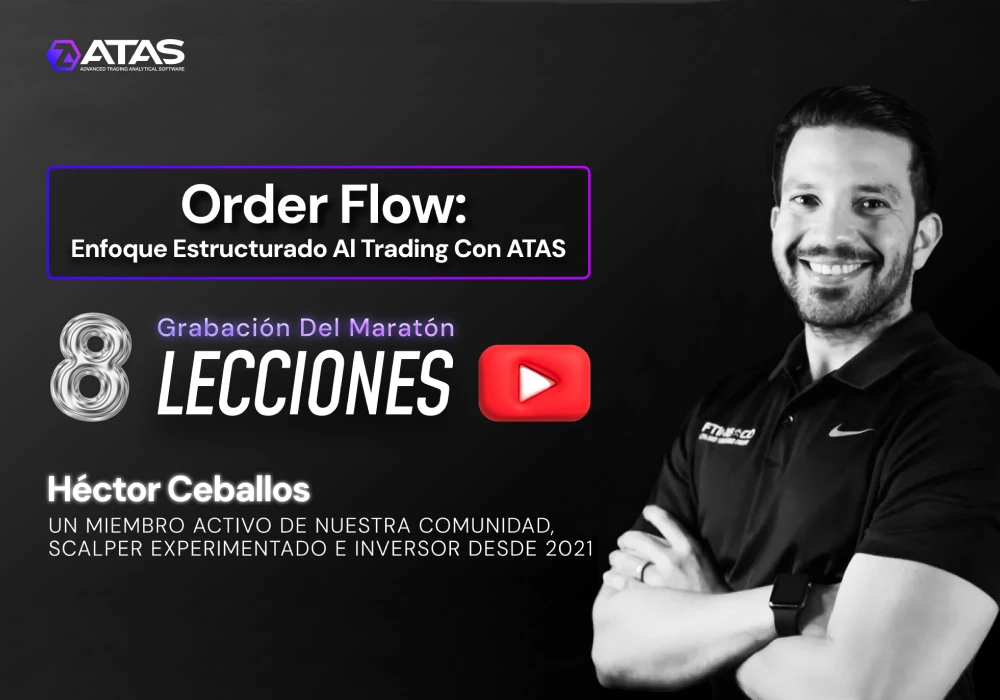
Free 8-part marathon. You’ll learn everything from the fundamentals of trading and volume analysis to advanced order execution techniques, risk management, and trading psychology.
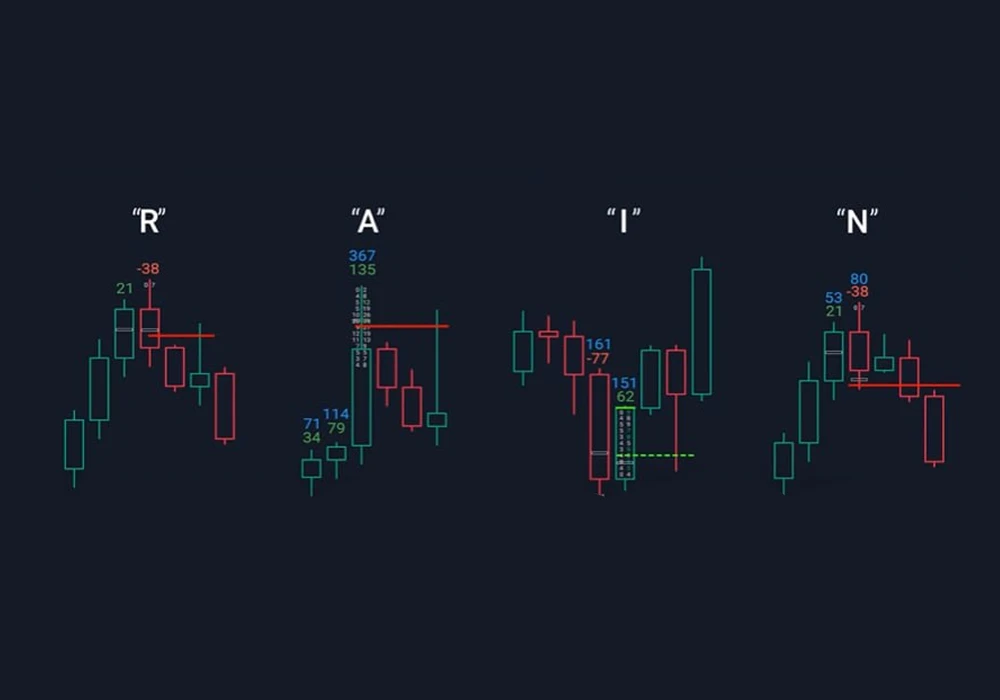
RAIN Template — a pre-configured footprint chart setup for ATAS. Visualizes four market patterns: Return, Absorption, Imbalances, Non-belief — for analyzing market reactions at support and resistance levels.