
 Publication:18.06.2026
The PFT Correlation
- Category: Algotrading
- Asset class: Futures, Stocks, Forex/CFD, Cryptocurrencies
Description
Custom script — intermarket correlation and divergence analysis tool
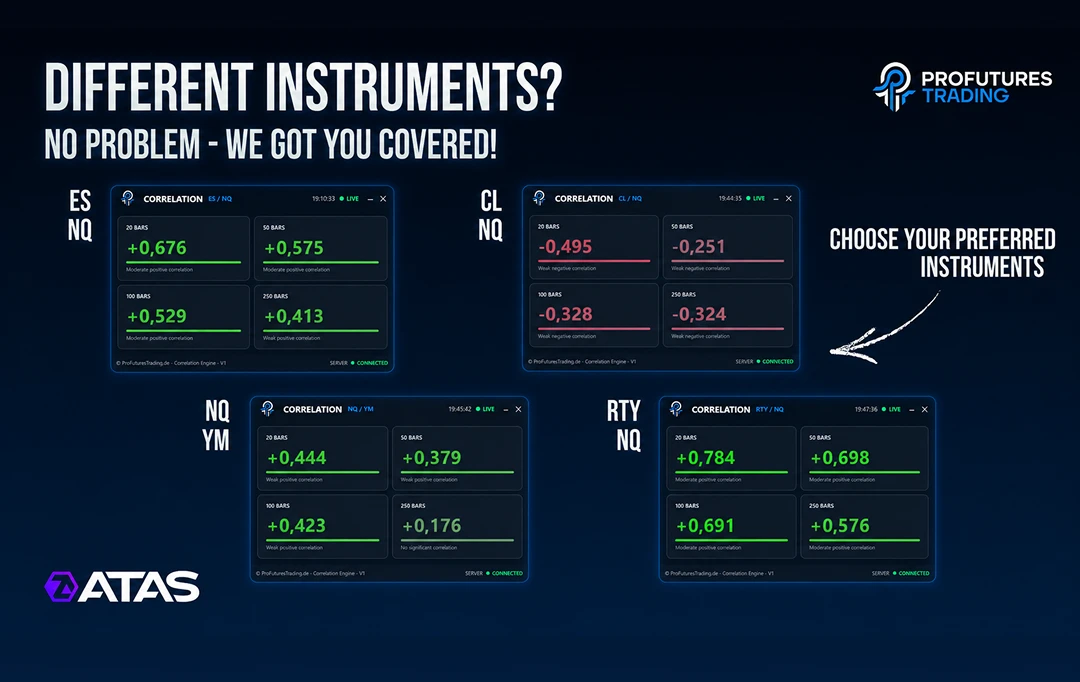
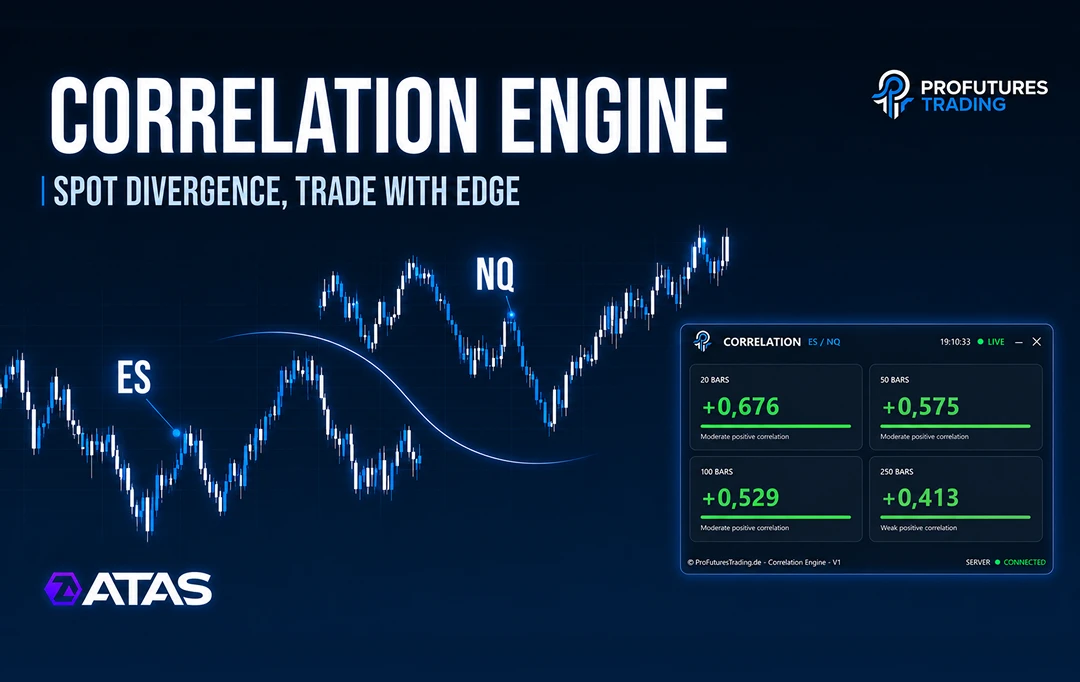
- Real-time correlation display between two selected instruments
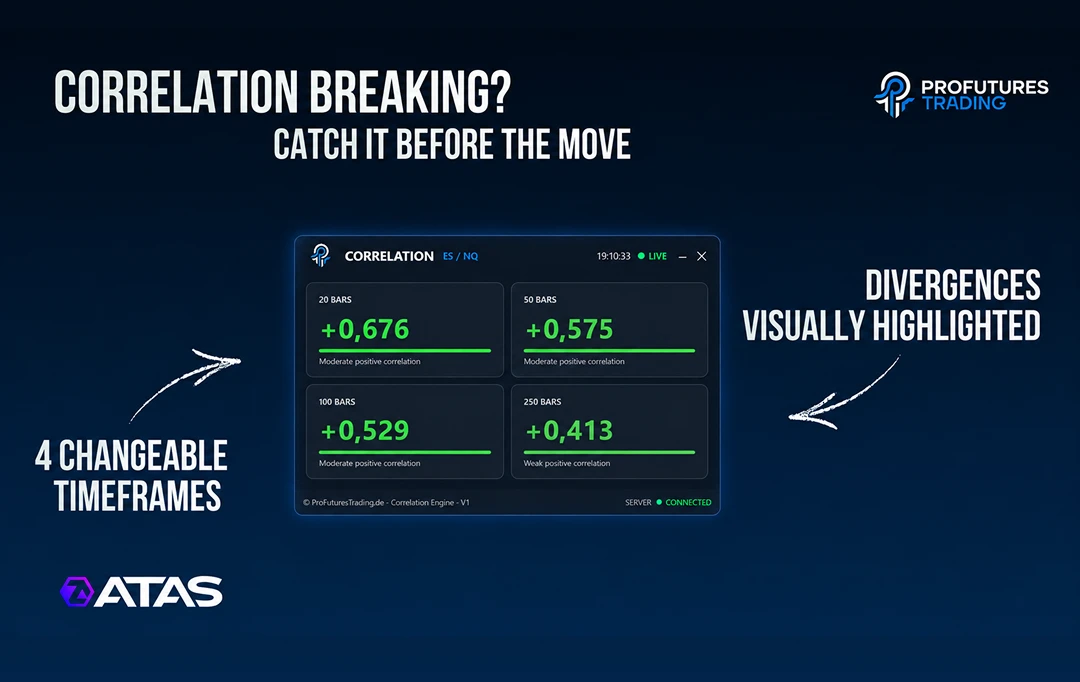
- Shows both short-term and longer-term correlation in a single view
- Divergence detection — flags when two normally correlated markets begin to separate
- Strength and weakness comparison — identify which instrument is leading or lagging
- Designed for all CME futures instruments, also compatible with crypto and forex
- Primary use case: NQ vs. ES, but fully configurable for any instrument pair
The PFT Correlation indicator calculates the rolling correlation coefficient between two user-selected instruments over configurable short-term and long-term lookback periods. The result is displayed as a visual correlation reading — showing whether the two markets are moving in sync, drifting apart, or actively diverging. When correlation weakens or breaks down, the indicator highlights the divergence, giving traders an additional data point to assess whether conditions are aligned or diverging before making an independent trading decision.
Users can select any two instruments available in ATAS as the correlation pair. Short-term and long-term lookback periods are fully adjustable. Visual display settings including colors and divergence thresholds are configurable directly within ATAS.
Use Cases
- Pre-trade confirmation — before analyzing an NQ setup, check if ES is confirming the same directional move. Aligned markets provide additional confluence; diverging markets may indicate reduced structural agreement.
- Divergence as a contextual indicator — if NQ is pushing to new highs but ES is lagging or reversing, the correlation breakdown may indicate reduced structural alignment, which traders can assess independently.
- Strength/weakness analysis — identify which instrument is leading the move to understand where relative initiative may be coming from.
- Multi-market context — use correlation data alongside order flow and bias tools to build a more complete analytical picture before making an independent trading decision.
Pricing: €9.99/month — 5-day free trial, card required, auto-renewal. Cancel anytime. Available via Copecart.
An original project analyzing ES and NQ: market structure, order flow, and levels based on options data. ProFuturesTrading shares educational content on YouTube and Discord and maintains a catalog of specialized services on its website.
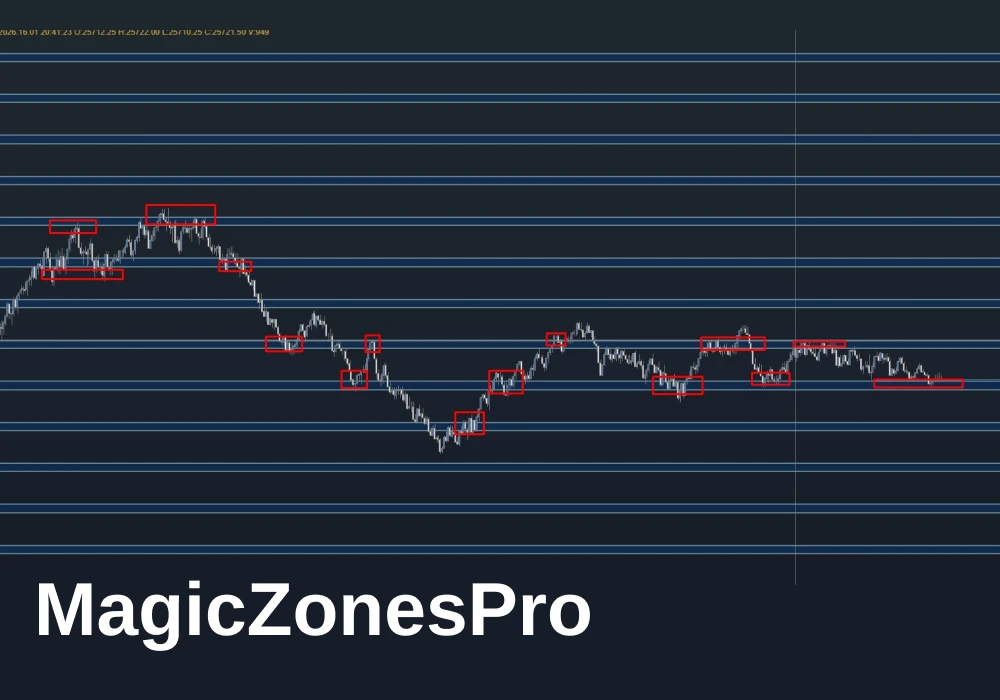
MagicZonesPro marks key options-derived zones on NQ for instant market context. Works with order flow tools (e.g., ATAS Big Trades) to follow activity when the price reaches a zone.
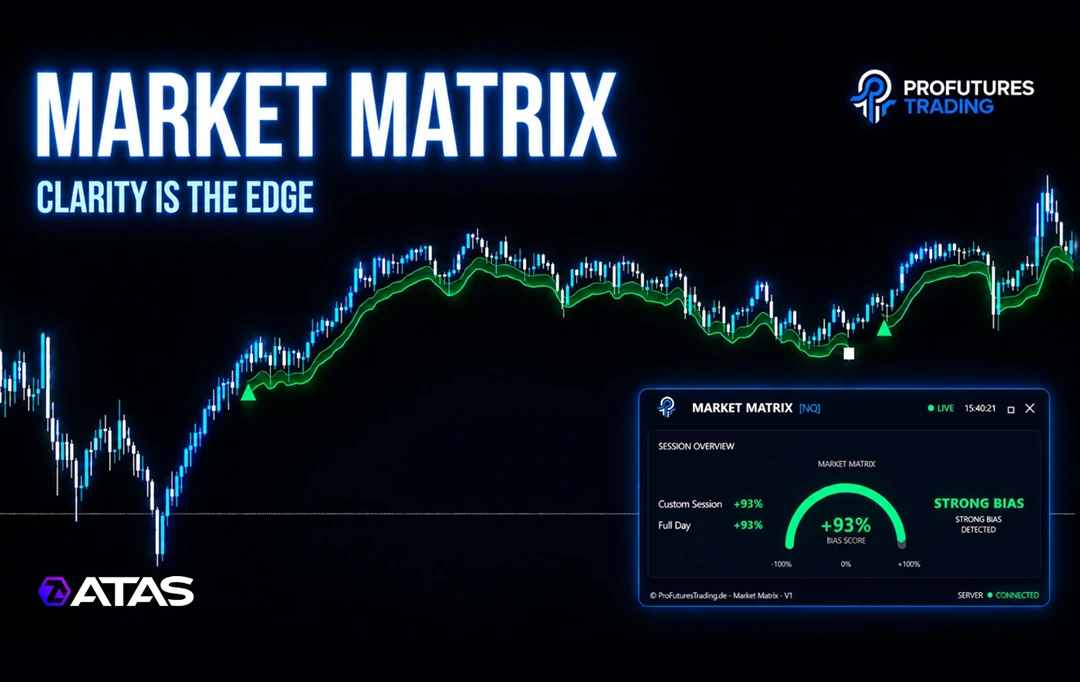
PFT Market Matrix reads market conditions in real time across all ATAS instruments and presents them in a structured format — helping traders cut through bias and focus on location, timing, setup, and risk management.
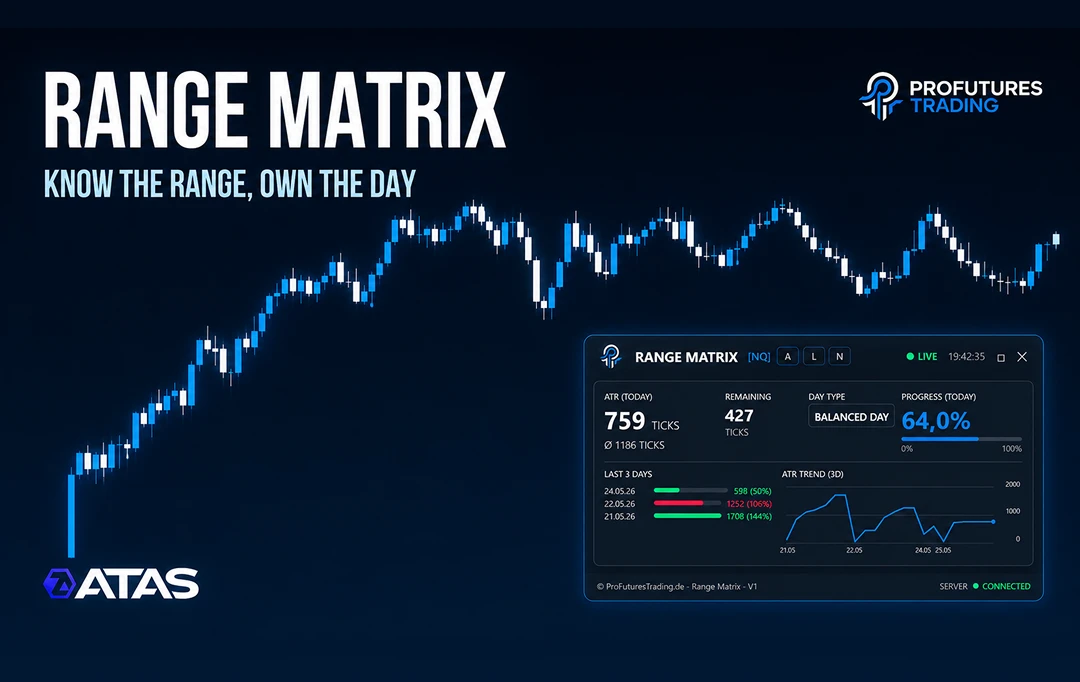
A session range indicator for ATAS showing how much of the typical daily range has been consumed — giving traders real-time context on remaining range potential relative to historical volatility. Compatible with CME, crypto and forex.
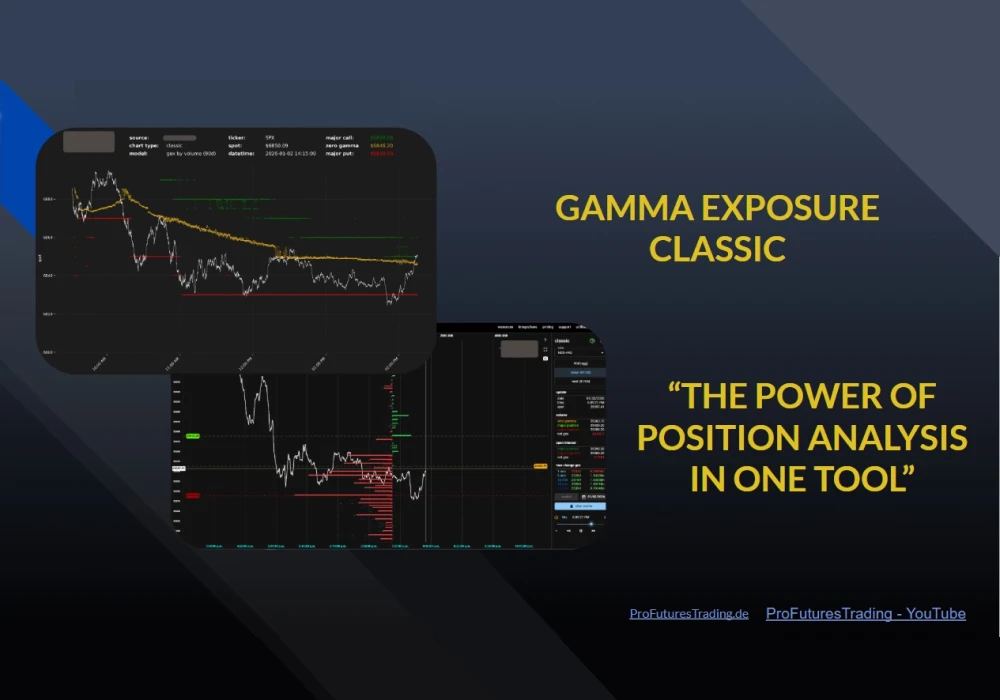
Structured framework for futures market analysis built around options positioning. Combines gamma exposure with order flow to highlight key locations where liquidity may concentrate, helping users read context beyond price-only moves.